Highlights:
- The market share of 1- to 5-year-old used cars priced under $20,000 has increased 30.3 percent since last year
- The average price of used cars is $32,672, a 4.7 percent decrease from 2023 and a 40.1 percent increase from 2019
- The average mileage of used cars is 39,109 miles, a 2.8 percent drop from last year, suggesting buyers are now paying less money for used cars with fewer miles
- This is a shift from 2019 to 2023, when the average mileage for used cars increased 5.6 percent, forcing buyers to pay more for cars with higher miles
- Today there are three popular used models available for under $20,000, compared to just one last year and eight in 2019
While used car prices remain well above pre-pandemic levels, the trend of ever-increasing prices has reversed over the past year. Used car prices have dropped 4.7 percent since 2023, and the availability of sub-$20,0000 cars has risen 30 percent. The average price for a 1- to 5-year-old used car is still 40.1 percent higher than 2019, but this downward shift in pricing has been consistent for the first 8 months of 2024.
iSeeCars analyzed over 17.9 million 1- to 5-year-old used cars sold between January and August of 2019, 2023, and 2024. Both pricing and mileage were analyzed to track changes over these five years.
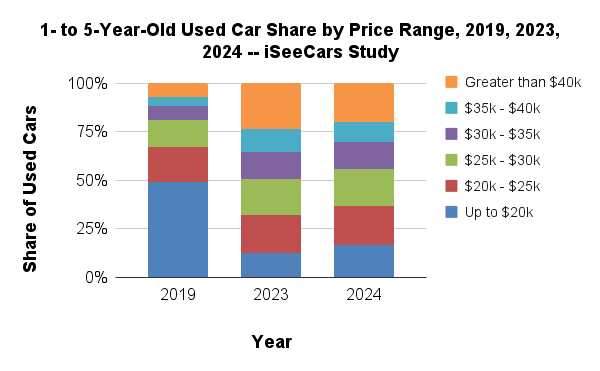
“After years of increasing used car prices we’ve finally seen prices drop in the past year,” said iSeeCars’ Executive Analyst Karl Brauer. “While $20,000 would buy approximately half of the 1- to 5-year-old used car market in 2019, that number was down to just 12.7 percent in 2023. Now it’s on the rise again, with 16.5 percent of used cars priced below $20,000 in 2024.”
After rising 47.0 percent, from $23,314 to $34,279 between 2019 and 2023, used car prices are down 4.7 percent to $32,672 in 2024. This shift comes from an increase in the share of used cars priced below $20,000, which had fallen from 49.5 percent in 2019 to 12.7 percent in 2023 – a drop of 74.4 percent. But the share of sub-$20,000 used cars went back up last year, increasing to 16.5 percent in 2024, a 30.3 percent bump in sub-$20,000 car availability since 2023.
“Used car prices remain well above pre-pandemic levels,” said Brauer. “But between their recent drop and the Fed’s cut in interest rates, buyers are looking at a meaningful improvement in used car affordability.”
| Used Cars By Price Range: 2019, 2023 and 2024 – iSeeCars Study | |||||
| Price Range | Share of Used Car Sales 2019 | Share of Used Car Sales 2023 | Share of Used Car Sales 2024 | % Change in Share, 2019-2023 | % Change in Share, 2023-2024 |
| Up to $10k | 3.0% | 0.1% | 0.1% | -97.7% | 100.0%* |
| $10k - $15k | 19.9% | 1.5% | 2.5% | -92.3% | 60.9% |
| $15k - $20k | 26.5% | 11.1% | 13.9% | -58.3% | 25.6% |
| $20k - $25k | 17.8% | 19.6% | 20.3% | 10.5% | 3.2% |
| $25k - $30k | 13.8% | 18.2% | 19.2% | 32.4% | 5.4% |
| $30k - $35k | 7.6% | 14.1% | 13.7% | 84.4% | -3.0% |
| $35k - $40k | 4.6% | 11.8% | 10.3% | 158.5% | -12.2% |
| $40k - $45k | 2.5% | 7.2% | 6.3% | 188.8% | -12.1% |
| $45k - $50k | 1.7% | 5.3% | 4.2% | 217.7% | -20.5% |
| $50k - $55k | 0.9% | 3.0% | 2.4% | 241.3% | -19.9% |
| $55k - $60k | 0.6% | 2.3% | 2.0% | 256.0% | -11.0% |
| $60k - $65k | 0.3% | 1.5% | 1.3% | 333.2% | -12.4% |
| $65k - $70k | 0.2% | 1.3% | 1.1% | 479.3% | -15.1% |
| Over $70k | 0.6% | 3.1% | 2.6% | 429.8% | -13.7% |
As shown in the table, all used car segments priced below $30,000 have increased in market share in 2024 while every segment above $30,000 has decreased. This further reflects a drop in market activity for pricier models.
Used Cars Becoming Cheaper and Less Used
The drop in used car pricing has been accompanied by a drop in the average mileage of these vehicles. This means buyers are not only paying less, they are also getting used models with fewer miles. Even better, some of the biggest mileage drops are in the lowest-priced segments, with used cars under $10,000 having 9.6 percent fewer miles, and used cars between $15,000 and $20,000 having 9.2 percent fewer miles.“In a complete reversal from the COVID era, where used car buyers had to pay more money for cars with more miles on them, today’s used car buyers are benefitting from not only lower prices but lower miles,” said Brauer. “They’re getting a less used car at a better price.”
| Used Car Average Mileage By Price Range: 2019, 2023 and 2024 – iSeeCars Study | |||||
| Price Range | Avg. Mileage 2019 | Avg. Mileage 2023 | Avg. Mileage 2024 | % Change in Avg. MIleage 2019-2023 | % Change in Avg. MIleage 2023-2024 |
| Below $10k | 72,920 | 116,887 | 105,699 | 60.3% | -9.6% |
| $10k - $15k | 48,478 | 85,211 | 78,669 | 75.8% | -7.7% |
| $15k - $20k | 37,349 | 60,512 | 54,919 | 62.0% | -9.2% |
| $20k - $25k | 34,951 | 45,472 | 41,900 | 30.1% | -7.9% |
| $25k - $30k | 34,170 | 39,718 | 37,616 | 16.2% | -5.3% |
| $30k - $35k | 30,802 | 37,126 | 35,538 | 20.5% | -4.3% |
| $35k - $40k | 30,075 | 34,672 | 33,145 | 15.3% | -4.4% |
| $40k - $45k | 28,825 | 31,433 | 30,051 | 9.0% | -4.4% |
| $45k - $50k | 27,137 | 30,464 | 29,475 | 12.3% | -3.2% |
| $50k - $55k | 23,451 | 29,357 | 28,609 | 25.2% | -2.5% |
| $55k - $60k | 20,339 | 28,932 | 28,004 | 42.3% | -3.2% |
| $60k - $65k | 18,118 | 27,592 | 25,751 | 52.3% | -6.7% |
| $65k - $70k | 16,921 | 25,701 | 23,079 | 51.9% | -10.2% |
| Over $70k | 12,434 | 16,614 | 15,029 | 33.6% | -9.5% |
Popular Models Are Getting More Affordable, With Lower Miles
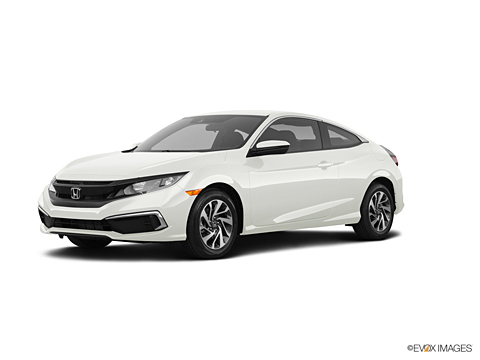
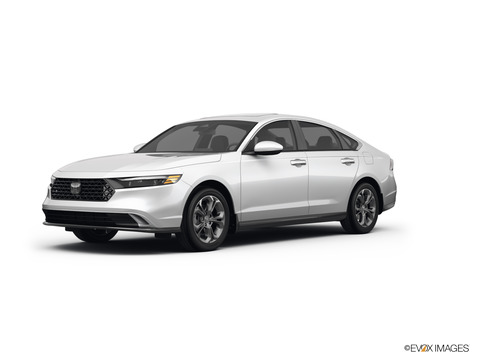
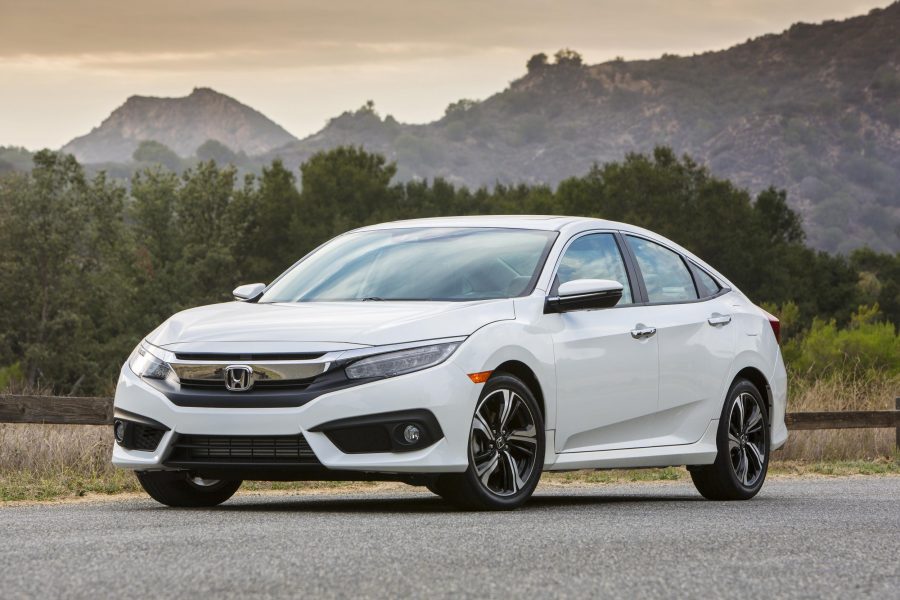
High-volume, popular used models have gotten more affordable in the past year. In 2019, eight of these 24 models were available for under $20,000, including the Chevrolet Equinox and Malibu, Honda Accord and Civic, and Toyota Corolla and Camry. But that number had dropped to just one, the Hyundai Elantra, in 2023. In 2024 three popular models are priced under $20,000, with the Chevrolet Malibu and Toyota Corolla rejoining the Hyundai Elantra at a sub-$20,000 price.“The sub-$20,000 club is still pretty elite, but at least a few used models fit that budget today versus a year ago,” said Brauer. “And if buyers can stretch to around $24,000, several additional models, including the Chevrolet Equinox, Honda Civic, Hyundai Tucson, and Nissan Rogue come into play.”
| Price Changes for Best Selling Used Cars: 2019-2023 and 2023-2024 – iSeeCars Study | ||||||
| Rank | Model | Avg. Price 2019 | Avg. Price 2023 | Avg. Price 2024 | % Change 2019-2023 | % Change 2023-2024 |
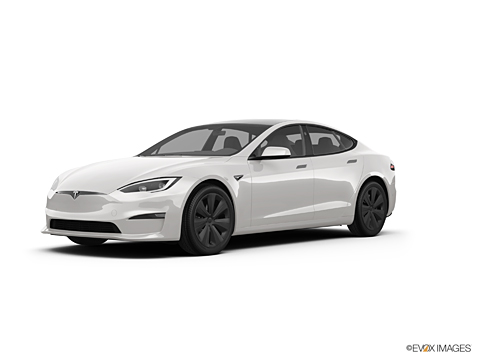
| 1 | Tesla Model 3 | $48,997 | $37,548 | $29,045 | -23.4% | -22.6% |
| 2 | Jeep Grand Cherokee | $27,394 | $34,107 | $30,956 | 24.5% | -9.2% |
| 3 | Ram 1500 | $27,318 | $42,716 | $39,206 | 56.4% | -8.2% |
| 4 | Ford Explorer | $26,412 | $34,667 | $32,105 | 31.3% | -7.4% |
| 5 | Chevrolet Equinox | $17,883 | $22,611 | $20,942 | 26.4% | -7.4% |
| 6 | Toyota Corolla | $14,236 | $21,243 | $19,793 | 49.2% | -6.8% |
| 7 | Subaru Outback | $23,309 | $29,306 | $27,348 | 25.7% | -6.7% |
| 8 | Honda Accord | $18,595 | $26,578 | $24,817 | 42.9% | -6.6% |
| 9 | Honda CR-V | $20,643 | $28,325 | $26,455 | 37.2% | -6.6% |
| 10 | Subaru Crosstrek | $20,646 | $26,433 | $24,699 | 28.0% | -6.6% |
| 11 | Mazda CX-5 | $20,460 | $26,122 | $24,520 | 27.7% | -6.1% |
| 12 | Toyota RAV4 | $20,632 | $28,997 | $27,236 | 40.5% | -6.1% |
| 13 | Chevrolet Malibu | $15,694 | $20,333 | $19,123 | 29.6% | -5.9% |
| 14 | Hyundai Tucson | $18,200 | $23,769 | $22,368 | 30.6% | -5.9% |
| 15 | Honda Civic | $16,574 | $24,234 | $22,879 | 46.2% | -5.6% |
| 16 | Toyota Highlander | $29,110 | $36,254 | $34,303 | 24.5% | -5.4% |
| 17 | Toyota Camry | $17,121 | $25,446 | $24,284 | 48.6% | -4.6% |
| 18 | Chevrolet Silverado 1500 | $29,626 | $40,249 | $38,606 | 35.9% | -4.1% |
| 19 | Hyundai Elantra | $13,199 | $18,676 | $18,022 | 41.5% | -3.5% |
| 20 | GMC Sierra 1500 | $32,811 | $47,189 | $45,904 | 43.8% | -2.7% |
| 21 | Nissan Rogue | $17,959 | $24,183 | $23,554 | 34.7% | -2.6% |
| 22 | Toyota Tacoma | $28,455 | $36,622 | $35,815 | 28.7% | -2.2% |
| 23 | Ford F-150 | $31,533 | $41,896 | $41,788 | 32.9% | -0.3% |
| 24 | Jeep Wrangler | $25,980 | $35,782 | $38,569 | 37.7% | 7.8% |
| Average of All 1- to 5-Year-Old Used Cars | $23,314 | $34,279 | $32,672 | 47.0% | -4.7% | |
| Changes in Average Mileage of Best-Selling Used Cars Priced Under $20,000: 2019-2023 and 2023-2024 – iSeeCars Study | ||||||
| Rank | Model | Avg. Mileage of Cars <$20k, 2019 | Avg. Mileage of Cars <$20k, 2023 | Avg. Mileage of Cars <$20k, 2024 | % Change, 2019-2023 | % Change, 2023-2024 |
| 1 | Hyundai Tucson | 35,414 | 69,527 | 55,818 | 96.3% | -19.7% |
| 2 | Honda CR-V | 45,253 | 102,824 | 84,652 | 127.2% | -17.7% |
| 3 | Honda Accord | 41,836 | 93,858 | 79,513 | 124.3% | -15.3% |
| 4 | Chevrolet Silverado 1500 | 94,655 | 140,978 | 119,838 | 48.9% | -15.0% |
| 5 | Mazda CX-5 | 47,995 | 76,697 | 65,934 | 59.8% | -14.0% |
| 6 | Jeep Wrangler | 74,978 | 72,084 | 62,100 | -3.9% | -13.9% |
| 7 | Jeep Grand Cherokee | 81,894 | 110,415 | 95,411 | 34.8% | -13.6% |
| 8 | Toyota Camry | 41,423 | 90,241 | 78,001 | 117.9% | -13.6% |
| 9 | Chevrolet Malibu | 40,992 | 69,389 | 60,081 | 69.3% | -13.4% |
| 10 | Subaru Outback | 69,412 | 104,257 | 91,280 | 50.2% | -12.4% |
| 11 | Honda Civic | 34,628 | 62,906 | 55,243 | 81.7% | -12.2% |
| 12 | GMC Sierra 1500 | 81,327 | 130,520 | 114,899 | 60.5% | -12.0% |
| 13 | Subaru Crosstrek | 55,250 | 89,273 | 78,592 | 61.6% | -12.0% |
| 14 | Hyundai Elantra | 37,545 | 55,896 | 49,719 | 48.9% | -11.1% |
| 15 | Toyota Corolla | 37,357 | 62,308 | 55,441 | 66.8% | -11.0% |
| 16 | Chevrolet Equinox | 41,881 | 71,513 | 63,696 | 70.8% | -10.9% |
| 17 | Ford F-150 | 97,267 | 143,008 | 130,204 | 47.0% | -9.0% |
| 18 | Toyota RAV4 | 42,956 | 101,906 | 93,072 | 137.2% | -8.7% |
| 19 | Toyota Highlander | 94,288 | 129,616 | 118,703 | 37.5% | -8.4% |
| 20 | Nissan Rogue | 37,949 | 72,923 | 67,017 | 92.2% | -8.1% |
| 21 | Ford Explorer | 81,724 | 107,925 | 99,358 | 32.1% | -7.9% |
| 22 | Toyota Tacoma | 75,924 | 99,395 | 101,953 | 30.9% | 2.6% |
| 23 | Ram 1500 | 82,512 | 127,218 | 133,984 | 54.2% | 5.3% |
| 24 | Tesla Model 3 | 212 | 84,739 | 91,371 | 39871.2% | 7.8% |
| Average of All 1- to 5-Year-Old Cars Price Under $20,000 | 44,015 | 63,819 | 58,905 | 45.0% | -7.7% | |
Changes in Affordable Cars by Metro Area
Across the nation’s 50 largest metropolitan areas by population, the share of cars priced under $20,000 dropped precipitously between 2019 and 2023, but the recovery from 2023 to 2024 varied from a large 100.5% increase in Seattle to a small 12.5% increase in Salt Lake City.| Largest Increases in Used Car Share Under $20,000 in Top 50 Metro Areas: 2023 vs. 2024 – iSeeCars Study | ||||||
| Rank | Metro Area | Share of Used Car Sales < $20k, 2019 | Share of Used Car Sales < $20k, 2023 | Share of Used Car Sales < $20k, 2024 | % Change Share, 2019-2023 | % Change Share, 2023-2024 |
| 1 | Seattle-Tacoma, WA | 44.4% | 10.4% | 20.9% | -76.5% | 100.5% |
| 2 | New York, NY | 47.9% | 12.0% | 17.8% | -74.9% | 48.3% |
| 3 | Philadelphia, PA | 51.5% | 11.6% | 17.1% | -77.4% | 46.9% |
| 4 | Detroit, MI | 52.9% | 12.9% | 18.9% | -75.5% | 46.3% |
| 5 | Boston, MA-Manchester, NH | 46.8% | 8.3% | 11.8% | -82.3% | 42.8% |
| 6 | West Palm Beach-Ft. Pierce, FL | 52.9% | 13.1% | 18.4% | -75.2% | 39.8% |
| 7 | Portland, OR | 45.0% | 11.9% | 16.6% | -73.5% | 39.6% |
| 8 | Los Angeles, CA | 54.1% | 12.4% | 17.3% | -77.1% | 39.5% |
| 9 | Washington, DC (Hagerstown, MD) | 51.4% | 12.4% | 17.2% | -75.8% | 38.4% |
| 10 | Dallas-Ft. Worth, TX | 45.8% | 12.6% | 17.4% | -72.5% | 37.7% |
| 11 | Fresno-Visalia, CA | 57.6% | 15.0% | 20.4% | -74.1% | 36.4% |
| 12 | Tampa-St Petersburg (Sarasota), FL | 55.0% | 17.2% | 23.3% | -68.7% | 35.2% |
| 13 | Las Vegas, NV | 54.0% | 14.3% | 19.3% | -73.5% | 34.9% |
| 14 | Phoenix, AZ | 53.8% | 14.7% | 19.8% | -72.7% | 34.5% |
| 15 | Milwaukee, WI | 49.6% | 10.7% | 14.3% | -78.4% | 34.0% |
| 16 | Orlando-Daytona Beach, FL | 56.7% | 18.3% | 24.4% | -67.7% | 33.5% |
| 17 | San Francisco-Oakland-San Jose, CA | 51.5% | 10.7% | 14.2% | -79.2% | 32.7% |
| 18 | Denver, CO | 41.6% | 9.1% | 12.1% | -78.1% | 32.6% |
| 19 | Oklahoma City, OK | 47.8% | 16.5% | 21.8% | -65.5% | 32.3% |
| 20 | Harrisburg-Lancaster-York, PA | 48.4% | 10.4% | 13.7% | -78.5% | 31.6% |
| 21 | Miami-Ft. Lauderdale, FL | 56.8% | 19.3% | 25.2% | -66.1% | 31.0% |
| 22 | Hartford & New Haven, CT | 52.5% | 11.9% | 15.6% | -77.3% | 30.6% |
| 23 | Nashville, TN | 47.6% | 12.5% | 16.2% | -73.6% | 29.2% |
| 24 | Raleigh-Durham (Fayetteville), NC | 51.3% | 12.5% | 16.0% | -75.7% | 28.3% |
| 25 | Cleveland-Akron (Canton), OH | 57.6% | 16.5% | 21.0% | -71.3% | 27.3% |
| 26 | Pittsburgh, PA | 48.1% | 12.2% | 15.4% | -74.8% | 26.9% |
| 27 | Charlotte, NC | 52.8% | 12.0% | 15.2% | -77.2% | 26.8% |
| 28 | St. Louis, MO | 49.8% | 12.6% | 15.8% | -74.8% | 26.1% |
| 29 | Greenville-Spartanburg, SC | 49.3% | 10.5% | 13.2% | -78.7% | 26.0% |
| 30 | Minneapolis-St. Paul, MN | 43.3% | 9.0% | 11.3% | -79.2% | 25.6% |
| 31 | Grand Rapids-Kalamazoo, MI | 48.8% | 12.0% | 15.0% | -75.5% | 25.2% |
| 32 | Baltimore, MD | 52.2% | 14.3% | 17.8% | -72.7% | 24.6% |
| 33 | San Antonio, TX | 49.4% | 12.5% | 15.6% | -74.6% | 24.5% |
| 34 | Atlanta, GA | 49.8% | 13.5% | 16.7% | -72.9% | 23.4% |
| 35 | Birmingham, AL | 46.6% | 12.1% | 14.7% | -74.1% | 22.2% |
| 36 | Houston, TX | 46.9% | 13.5% | 16.4% | -71.3% | 22.1% |
| 37 | Columbus, OH | 55.4% | 15.7% | 19.2% | -71.6% | 22.1% |
| 38 | Sacramento-Stockton-Modesto, CA | 52.0% | 13.7% | 16.6% | -73.7% | 21.7% |
| 39 | Norfolk-Portsmouth-Newport News,VA | 56.7% | 15.2% | 18.5% | -73.2% | 21.4% |
| 40 | Chicago, IL | 51.5% | 14.3% | 17.2% | -72.3% | 20.5% |
| 41 | Jacksonville, FL | 55.0% | 17.4% | 20.9% | -68.3% | 20.2% |
| 42 | Albuquerque-Santa Fe, NM | 46.7% | 11.8% | 14.2% | -74.7% | 19.8% |
| 43 | San Diego, CA | 53.6% | 14.9% | 17.6% | -72.3% | 18.2% |
| 44 | Louisville, KY | 52.3% | 14.2% | 16.6% | -72.8% | 17.0% |
| 45 | Cincinnati, OH | 56.2% | 16.7% | 19.5% | -70.2% | 16.5% |
| 46 | Austin, TX | 49.9% | 10.4% | 12.1% | -79.2% | 16.3% |
| 47 | Greensboro-Winston Salem, NC | 53.2% | 15.1% | 17.6% | -71.6% | 16.2% |
| 48 | Indianapolis, IN | 51.7% | 13.7% | 15.9% | -73.6% | 16.1% |
| 49 | Kansas City, MO | 50.8% | 14.2% | 16.2% | -72.0% | 13.7% |
| 50 | Salt Lake City, UT | 48.5% | 15.1% | 17.0% | -68.9% | 12.5% |
iSeeCars analyzed over 17.9 million 1- to 5-year-old used cars sold between January and August of 2019, 2023, and 2024. List prices and average odometer readings were tallied and aggregated to compare the share of cars at various price points across the three periods, as well as to compare the average mileage of cars. A selection of best-selling vehicles were additionally analyzed and ranked.
About iSeeCars.com

