Best Resale Value Car Brands
How do car brands compare in terms of resale value? Which vehicle model has the best and least resale value within a given brand? We analyzed over 3 million listings to determine the resale value for each model.
It’s easy to focus on purchase price when buying a new vehicle, while related expenses, including insurance, maintenance, and fuel economy, are often considered by new car shoppers. But the single most expensive component when buying a new vehicle is, usually, the difference between what you pay at the dealership and what the car is worth a few years later.
Known as resale value, this is defined as a new car’s original value when purchased and residual value (or retained value) after a few years. The most common timeframe for determining resale value is 3 years after a new car is purchased or leased, because that is the most common timeframe for a new car lease. But a car’s retained value after 5 years is another popular reference point used to determine its resale value.
Regardless of timeframe, it’s common for a vehicle to lose between 20 percent and 50 percent of its value after 3 years. Given the average new car costs close to $50,000, that means you can easily lose between $10,000 and $25,000 through a vehicle’s drop in value. This is why a car’s diminished value is often the most expensive “cost” you’ll pay when buying a new car, and why buying a vehicle with a high resale value can save you a lot of money when it’s time to sell or trade in your car for a new one.
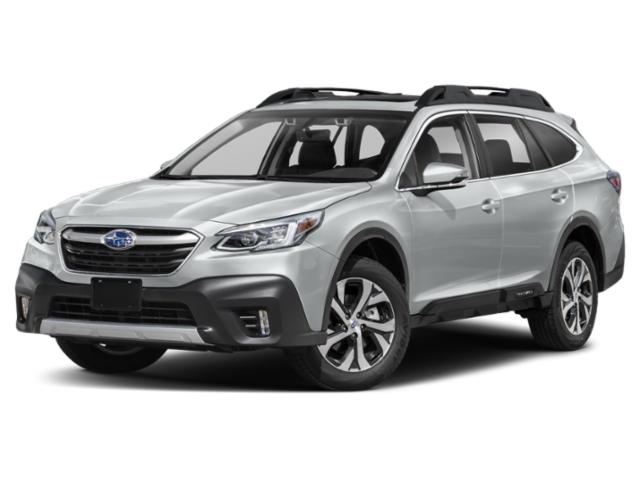
iSeeCars has identified which cars have the best resale value and listed them on our Best Resale Value Cars page. But we’ve also identified the best resale value cars by brand and listed them below. If you have a preferred brand you can quickly see which model(s) offer the best resale value for that brand. Some automakers, like Subaru and Toyota, are known for having excellent resale value, while others, like Buick and GMC, consistently have relatively low resale value.
Keep in mind that different types of vehicles tend to have higher or lower resale value. Sports cars and full-size pickup trucks will, in general, retain more value over time than luxury cars and minivans. And specialized off-road vehicles, like the Ford Bronco or Jeep Wrangler, will have higher resale value than common vehicle types like compact cars and sedans. For instance, the Toyota Corolla and Honda Accord both offer strong resale in their category, but not as strong as a Chevrolet Silverado or Ford Maverick, simply because those are both trucks.
Ultimately you’ll want to buy a vehicle that suits your needs. But if you identify more than one model that can serve your driving needs it’s a smart financial move to buy the one with higher resale value.

How We Rank These Cars
The iSeeCars brand resale values indicate how well each car brand retains its value after the first 5 years based on the resale value of its models
The best brands offer models with the highest resale values within their respective vehicle segments. Along with the Retention or resale value scores, we show comprehensive iSeeCars ratings for each brand’s models, because we believe multiple factors should be taken into account when buyers are seeking the best overall vehicle. Two of these factors are safety and reliability, both of which are included in our ratings system.
The overall iSeeCars Score is an analysis of these three factors: reliability, resale value and safety. It is calculated based on the latest research and analysis by our data science team. The data analysis comes from over 12 million new and used vehicles in our Longest-Lasting Cars and 5-Year Depreciation Studies, combined with NHTSA and IIHS Safety Ratings.
Vehicles are scored in three categories:

Reliability
The reliability score represents an analysis of iSeeCars' proprietary research on the longest-lasting vehicles.

Value Retention
The value retention score is based on our data science team's statistical analysis and prediction of 5-year depreciation from MSRP to determine which cars hold their value best, using US Bureau of Labor Statistics data to adjust for inflation.

Safety
The safety score is calculated based on the last five years of crash test ratings from the National Highway Traffic Safety Administration (NHTSA) and incorporates the latest Top Safety Pick information from the Insurance Institute for Highway Safety (IIHS).

